AiVRIC Academy
Course progress
0%
Foundation Course

Getting Started with RiskOps

RiskOps is the discipline of treating risk management as a continuous operational process — not a quarterly audit. This course teaches you the end-to-end flow used in CloudSignals, the reasons each stage exists, and the exact navigation sequence to execute it in your tenant.
~45 minutes 5 modules + knowledge checks Beginner – Intermediate
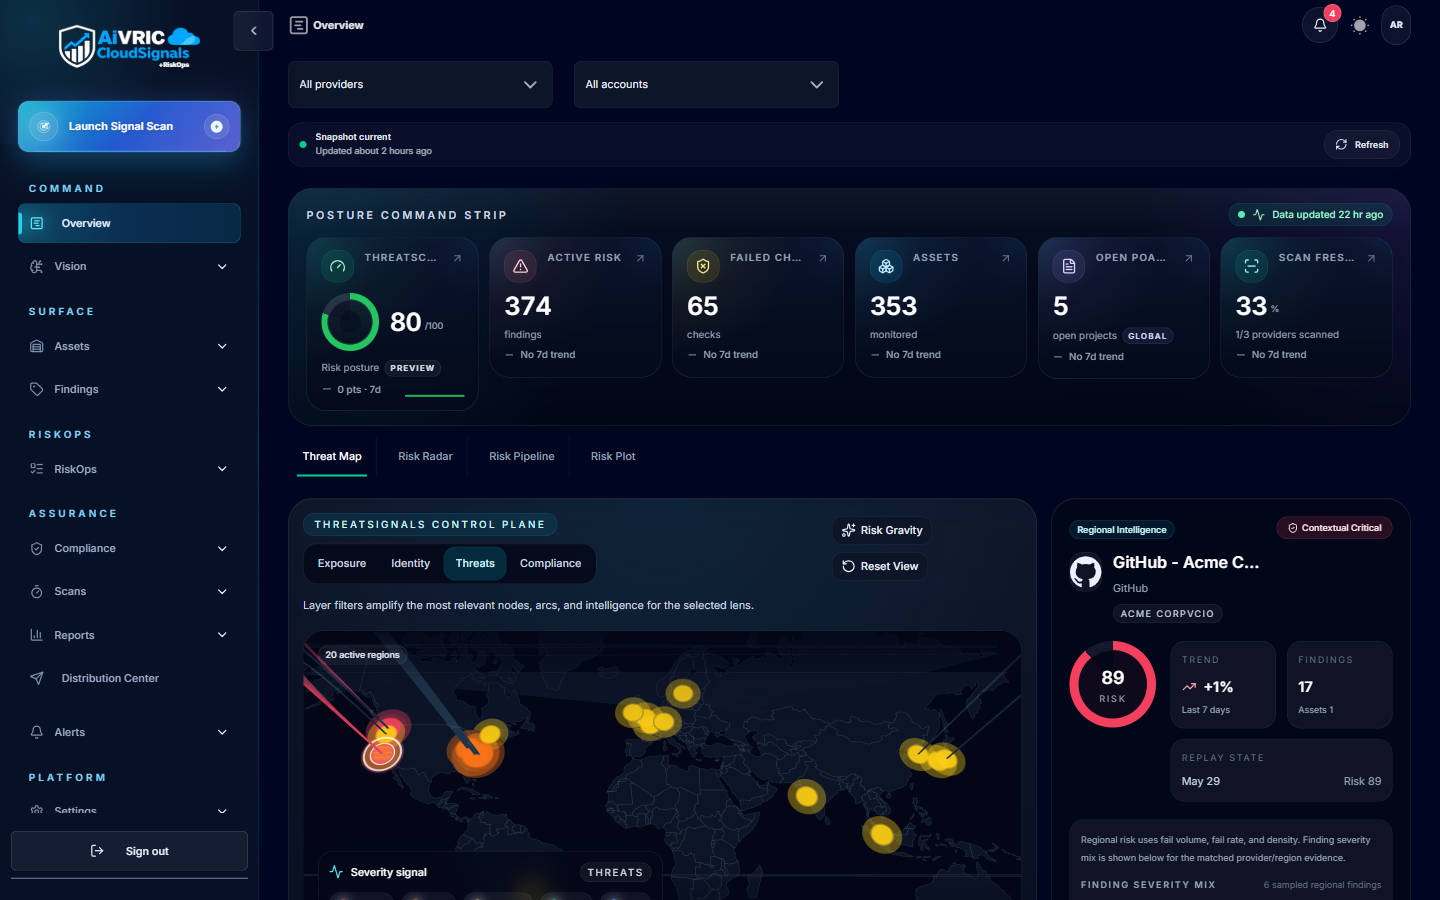
Live app Expand CloudSignals Overview dashboard showing the posture command center with threat score, findings count, threat map, and control plane activity
CloudSignals Command Center — threat score, active findings by severity, threat map, and posture control plane — the daily starting point for every RiskOps session.

The RiskOps flow model

Risk in CloudSignals travels as a chain of linked objects. Each object in the chain has a specific role: signals flow in one direction, but accountability and closure flow back. Understanding the chain is the prerequisite for everything else.

What makes RiskOps different from traditional risk management

Traditional risk management is periodic: a team does an annual risk assessment, produces a spreadsheet, and revisits it twelve months later. By then, the threat landscape, your cloud estate, and your compliance posture have all changed — often significantly.

RiskOps treats risk as a continuous operational signal, not a static artifact. In practice this means:

  • Findings are generated automatically on a 24-hour cadence (or on-demand) as CloudSignals evaluates your connected providers against policy controls.
  • Decisions are made continuously — every finding that enters the system should be triaged, not queued indefinitely.
  • Governance is operationalized — risk acceptance, treatment approvals, and evidence collection are tracked in the platform, not in email threads or spreadsheets.

Where flow breaks down

RiskOps health degrades at two predictable bottlenecks:

Decision bottleneck

Findings are being discovered faster than they are being dispositioned into treatments or accepted risks. This causes a growing "pending decisions" backlog — a leading indicator that the team's triage process needs structure or capacity.

Mapping bottleneck

Findings and risks lack ownership linkages — no assigned asset owner, no business process connection, no named accountable party. This inflates risk pressure scores and makes prioritization unreliable because severity can't be contextualized against impact.

Before you begin: Make sure at least one cloud provider connector is configured and has completed at least one scan. You'll need findings in the system to execute the steps in each module. Navigate to Settings > Connectors if you haven't connected a provider yet. See the Connector Setup Guide for step-by-step instructions.
1

Asset Inventory

Establish the anchor for every risk signal in your environment.

What assets are

In CloudSignals, assets are the cloud resources, managed services, and configured entities in your connected environment — things like virtual machines, storage buckets, databases, Kubernetes clusters, IAM roles, and repositories. Assets are discovered automatically when you connect a provider; they populate your inventory at /assets.

Assets serve as the technical anchor for the risk chain. When CloudSignals evaluates a policy and finds a misconfiguration, it attaches that finding to the specific resource where the failure occurred. The finding then inherits ownership context from the asset — who owns this resource, which team manages it, what managed entity (business unit, product, environment) it belongs to.

Why asset completeness matters

If a finding can't be linked to a properly-owned asset, it becomes an orphaned signal. Orphaned signals contribute to mapping gaps in your risk pressure score and make it difficult to route findings to the right person for triage. The two most common causes are:

  • Missing asset ownership — resources exist in inventory but have no assigned owner or managed entity. This usually happens with legacy accounts or resources spun up outside a formal process.
  • Unconnected providers — resources exist in a cloud account that hasn't been connected to CloudSignals yet, so those assets (and their findings) are invisible.
In the platform — Review your asset inventory
1
Navigate to Assets in the main navigation (or go directly to /assets).
2
Review the total asset count and confirm it aligns with your expected inventory size. Large discrepancies may indicate a connector scope issue or recently added accounts.
3
Filter by Provider to see which cloud accounts are contributing the most assets. Accounts with unexpectedly low asset counts may indicate an incomplete connector scope.
4
Look for assets with no assigned Owner or no linked Managed Entity. These are ownership gaps you'll want to close before findings triage begins — ownership is required for accurate routing.
5
For each unowned asset, click into the asset detail and assign a managed entity or tag it to a team. If your identity provider is connected, SCIM provisioning can automate this mapping.
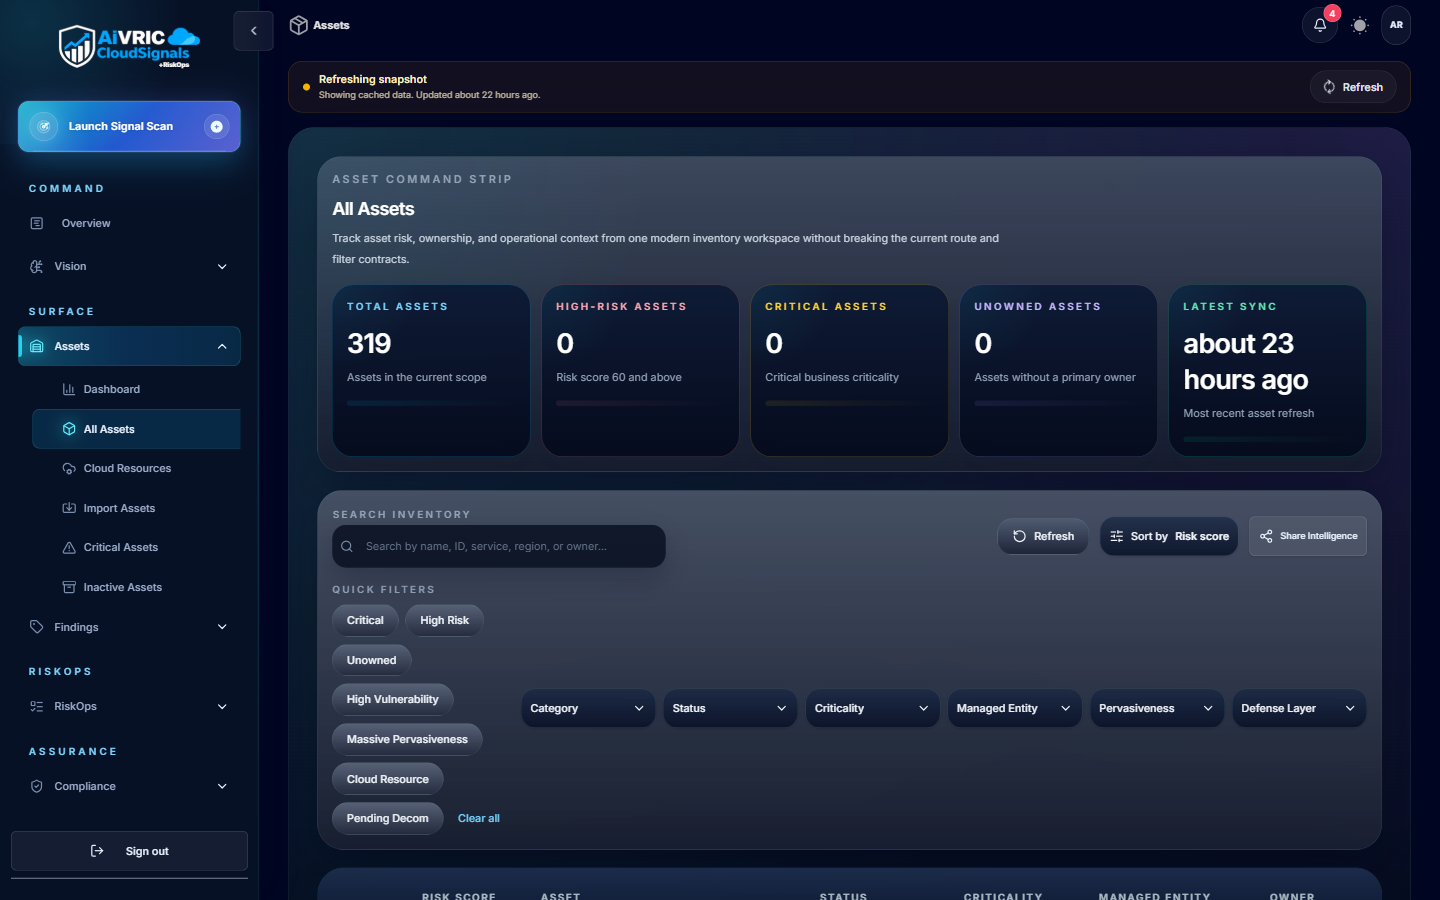
Live app — /assets Expand CloudSignals All Assets view showing 319 discovered assets with ownership coverage, unscanned asset count, and last sync timestamp
Asset inventory — 319 discovered assets with sync freshness, ownership gap indicators, and quick-filter controls. The unowned count is the first metric to drive toward zero.

Key actions for this phase

Confirm asset count: Verify the total asset count reflects your actual environment. Flag unexplained gaps to your cloud team.
Identify unowned assets: Filter for assets with no owner or managed entity. Prioritize resources tagged as critical or production.
Assign ownership: For each unowned asset, link to a managed entity and assign a responsible team or individual.
Review connector scope: Confirm all cloud accounts, regions, and subscriptions are covered by your connectors.
Knowledge Check
What is the primary role of assets in the RiskOps flow?
They generate compliance framework scores automatically based on provider configuration.
They are the anchor that findings attach to, establishing ownership and impact context for each risk signal.
They define the SLA and expiry date for treatment plans.
They determine which governance decisions require dual approval.
Completing this phase updates your progress and unlocks the next section.
2

Findings Triage

Convert control failures into risk decisions — not a growing backlog.

What findings are

A finding in CloudSignals is the output of a failed policy evaluation. Each scan compares your connected resources against your active policy controls; when a resource doesn't meet the expected configuration, CloudSignals records a finding. Findings are the primary technical risk signal in the system.

Findings are classified by severity:

SeverityMeaningExpected response time
● CriticalImmediate, high-confidence exposure — often exploitable without authentication or with broad blast radius (e.g., publicly exposed database, over-privileged IAM with admin on sensitive account).Same business day
● HighSignificant control gap with realistic exploitation path. Requires context-aware triage to confirm impact before remediation.Within 5 business days
● MediumDefense-in-depth gap or configuration drift that increases risk but requires chained conditions to exploit.Within 30 days
● LowBest-practice deviation or hygiene issue with minimal direct exploitation value. Batch remediation is acceptable.Next review cycle

The three triage decisions

Every finding must be dispositioned. There are exactly three valid triage actions:

Remediate

Fix the root cause. The finding is a genuine control failure with a known fix. Create a treatment plan or assign a ticket. Track to closure. This is the preferred outcome for Critical and High findings.

Mitigate

The root cause cannot be fully eliminated right now (technical debt, third-party constraint, migration in-flight). Implement a compensating control that reduces likelihood or impact. Document it as a treatment plan with a target remediation date.

Accept

The residual risk is within your organization's risk appetite — the cost to fix exceeds the benefit, or a business justification makes the current state acceptable. Formal risk acceptance requires: owner, justification, expiry date, and approver. Never use accept as a way to skip triage.
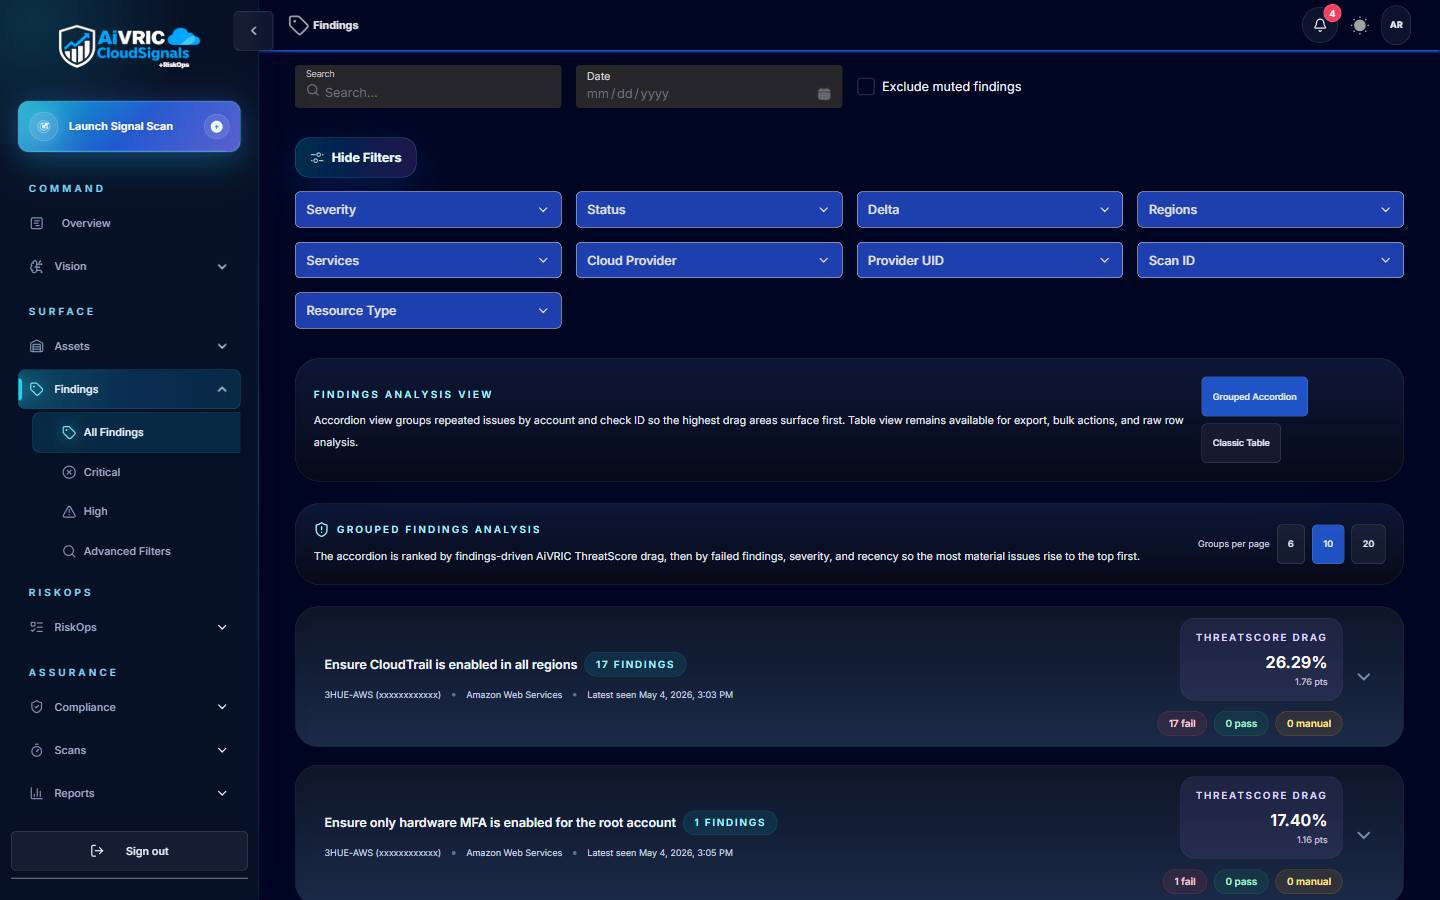
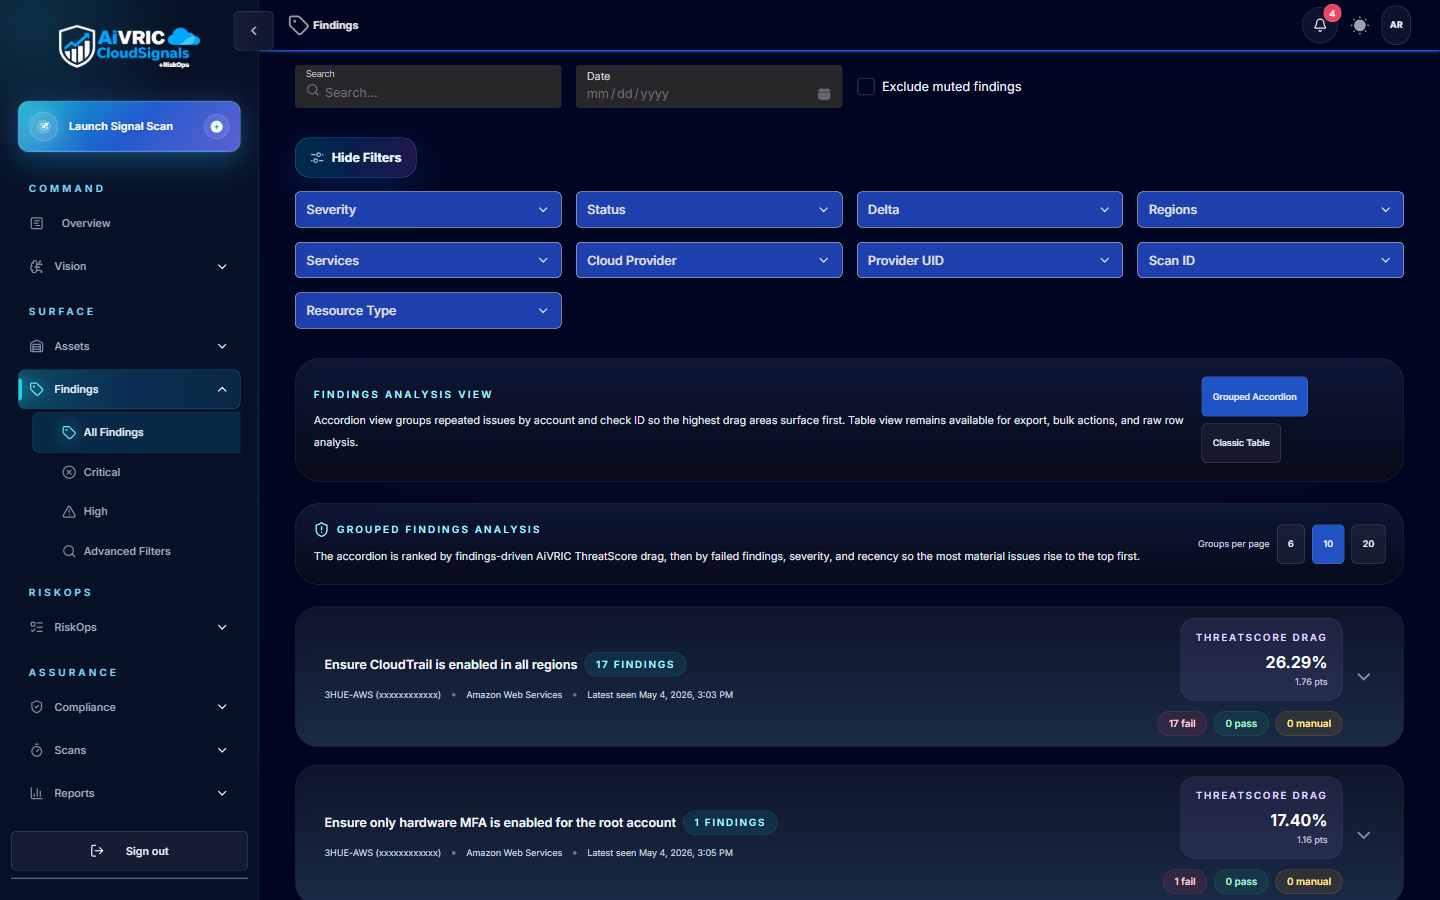
/findings Expand Findings list filtered to Critical and High severity with AI-grouped analysis showing root cause patterns across findings
Findings — Critical & High filter active. AI groups related findings by root cause so you treat a pattern, not isolated alerts.
Finding detail Expand Individual finding detail panel showing affected resource, control description, severity, remediation steps, and linked asset
Finding detail — affected asset, failing control, remediation guidance, and triage action buttons in one panel.
A finding left in "pending" is a decision you're deferring, not avoiding. Each pending finding continues to apply risk pressure to your score and represents an unmitigated exposure window. High-volume pending queues almost always indicate that triage hasn't been operationalized into a regular cadence.
In the platform — Triage your first findings
1
Navigate to Findings in the main navigation (or go to /findings).
2
Filter by severity: Critical and High. Start here — these are the findings that should drive immediate risk decisions. Don't start with Medium or Low; you'll lose the signal in the noise.
3
Click into the first Critical finding. Review: the failing resource, the control that failed, the suggested remediation steps, and any related findings on the same resource.
4
From the finding detail, pivot to the affected asset — confirm the owner, managed entity, and environment (prod/staging/dev). This context determines how urgently to act.
5
Make your triage decision: Remediate (create a treatment plan), Mitigate (note compensating control and create a plan), or Accept (fill in owner, justification, expiry date, approver).
6
Repeat for the next Critical finding. Aim to triage all Critical findings in a single session. Schedule a recurring 30-minute weekly slot to work through High findings.

Key actions for this phase

Triage all Critical findings: Work through every Critical finding and assign a disposition — no Critical should remain in "pending" status after your first triage session.
Schedule a weekly High triage cadence: Block 30 minutes per week to work High findings. The goal is zero High findings older than 5 business days without a decision.
Verify asset linkage for each finding: Confirm that each Critical/High finding links to a properly-owned asset. Findings without asset linkage need ownership investigation before triage.
Establish a triage policy: Document which team is responsible for which provider or namespace. Finding routing works best when ownership rules are pre-defined, not negotiated per-finding.
Knowledge Check
When you encounter a Critical finding, what are the three valid triage dispositions?
Escalate, Monitor, and Archive
Patch, Quarantine, and Delete
Remediate, Mitigate (with compensating control), and Accept (with documented justification)
Alert, Suppress, and Defer
Move on when you've triaged at least your Critical findings and scheduled a recurring High triage slot.
3

Business Process Mapping

Connect technical risk signals to the operational outcomes that matter to your organization.

What business processes are in CloudSignals

A business process in CloudSignals is an operational area that your organization depends on — things like "Payment Processing," "Customer Data Platform," "Engineering CI/CD Pipeline," "HR Systems," or "Regulatory Reporting." Business processes give you the impact lens that transforms a technical finding into a business risk statement.

Without this lens, a finding like "S3 bucket has public read access" is a technical observation. With business process mapping, it becomes: "The S3 bucket hosting customer export files for the Customer Data Platform is publicly readable — risk to confidentiality of customer records, potential regulatory exposure under GDPR."

Why mapping gaps inflate risk pressure

Your risk pressure score (expressed as a number from 0–100) is a composite measure that accounts for finding severity, asset criticality, and — critically — mapping completeness. When findings or risks aren't linked to business processes and process owners, the platform treats them as unaccountable exposure. This directly drives up risk pressure, even if the underlying technical risk is relatively low.

Mapping gaps also prevent effective prioritization. You can't triage a finding as "low business impact" if there's no business process linked to assess impact against.
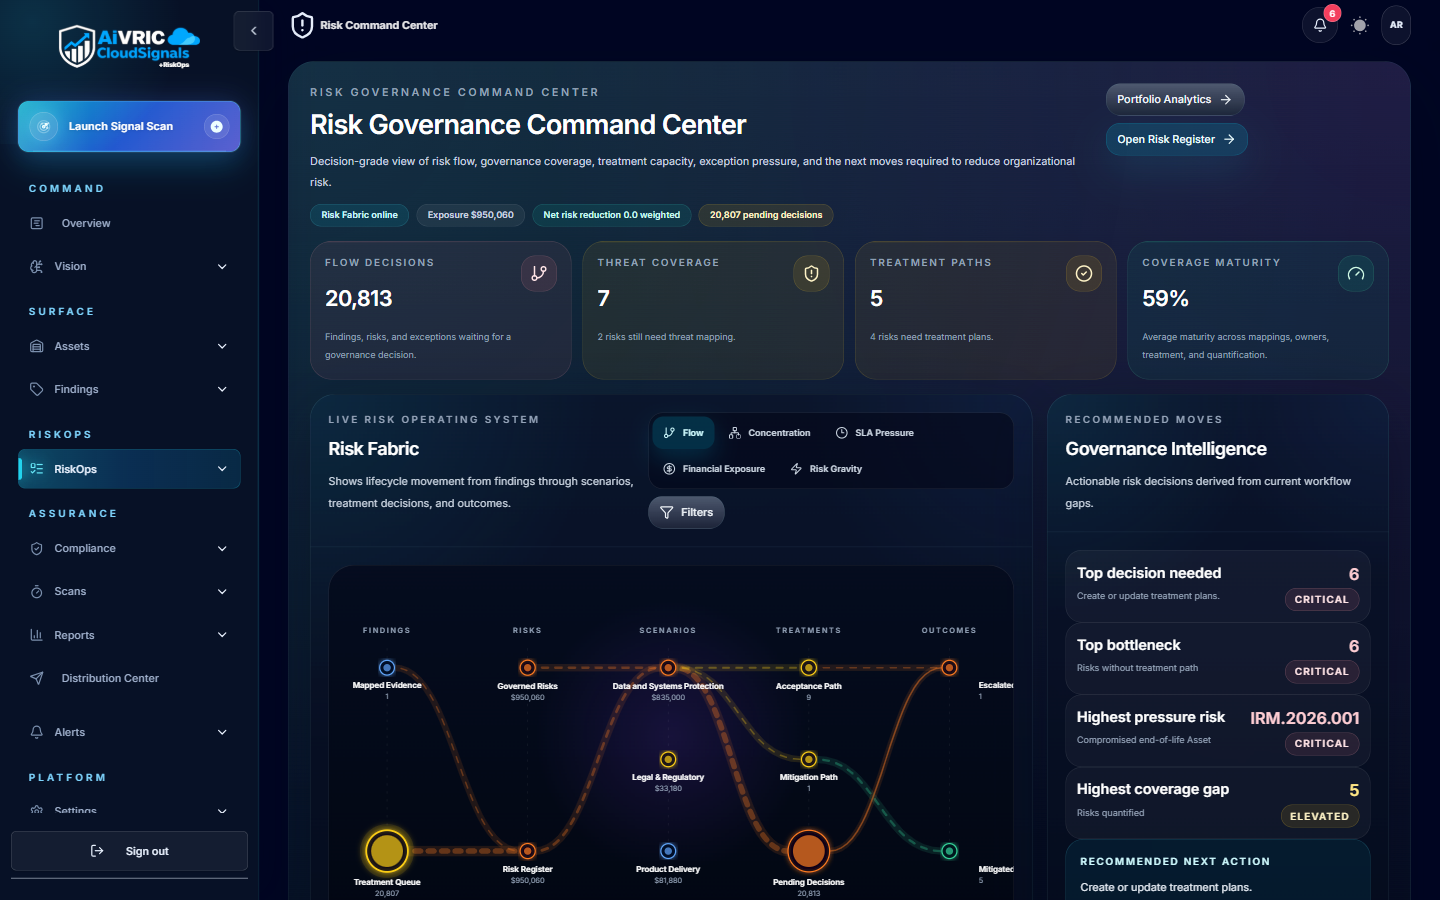
/risks Expand Risk Governance Command Center with open decisions count, threat coverage, treatment plans, Risk Fabric visualization, and AI Governance Intelligence panel
Risk Governance Command Center — 20,813 open decisions, threat coverage, treatment plans, and the Risk Fabric flow diagram connecting threats through assets to governance decisions. Governance Intelligence surfaces the highest-pressure items on the right.
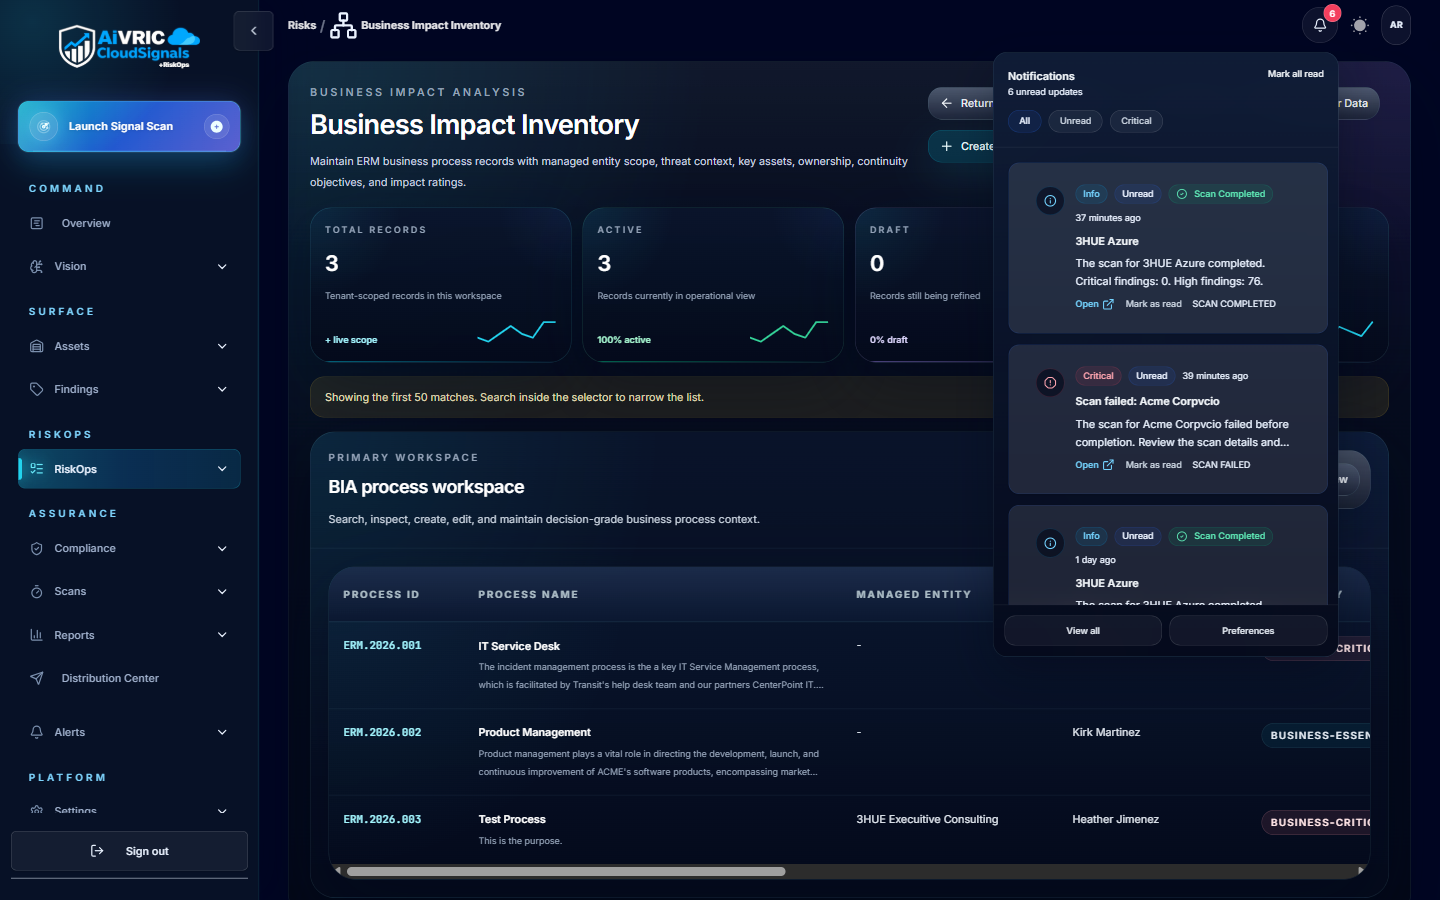
/risks/business-processes Expand Business Impact Inventory showing business process workspace with BIA process records, managed entity linkage, and ownership columns
Business Impact Inventory — each business process record has an ID, name, managed entity, owner, and criticality. The process workspace is where you confirm which assets support each process and where risk impact gets anchored.
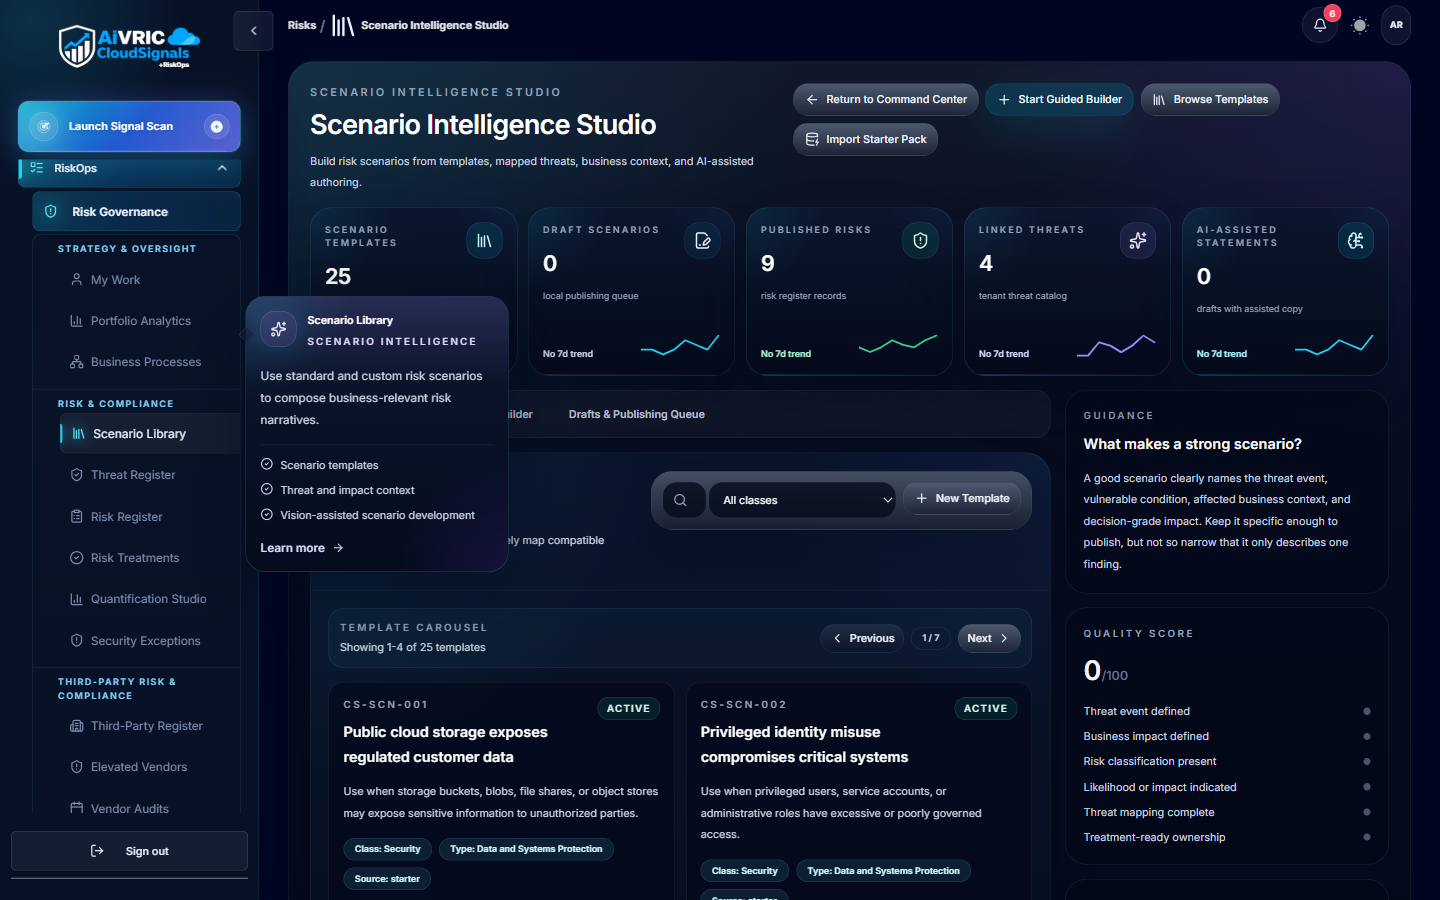
/risks/scenarios Expand Scenario Intelligence Studio with scenario library, cloud storage exposure and privileged identity misuse template cards, and scenario quality evaluation panel
Scenario Intelligence — reusable risk scenarios built from templates link threat events to business impact. Each scenario card shows likelihood, impact, and whether it meets quality standards before publishing to the risk register.
Mapping doesn't have to be perfect to be valuable. Start by identifying your three to five most critical business processes — the ones where a security incident would cause regulatory liability, revenue loss, or material customer harm. Map findings there first. You can expand coverage iteratively.
In the platform — Map findings to business processes
1
Navigate to Risks in the main navigation (or go to /risks). This is the hub for business process management, risk register, and portfolio exposure.
2
Open the Business Processes section. You'll see any processes already defined. If none exist, create your first process — start with the operational area at highest risk based on your findings triage.
3
For each business process, click into it and review supporting assets. These are the cloud resources whose failure would directly impact this process. Confirm the linkage is accurate.
4
From the business process view, see which open findings are associated with its supporting assets. These are the findings whose risk most directly threatens this process.
5
Assign a process owner — the person accountable for the operational outcome of this process. This person should participate in risk acceptance decisions for findings that affect this area.
6
Review your Risk Governance summary and note your current risk pressure score. After completing this phase, you should see the mapping gap component decrease as you add process definitions and linkages.

Key actions for this phase

Define your top 3–5 business processes: Start with the operational areas most critical to revenue, regulatory compliance, or customer trust.
Link supporting assets to each process: For each process, confirm which cloud resources support it and ensure those assets are correctly linked in the platform.
Assign process owners: Name an accountable owner for each business process. Owners receive notifications when linked findings are created or change severity.
Note your baseline risk pressure score: Record your current score so you can measure improvement after the full RiskOps cycle is running.
Knowledge Check
What does a "mapping gap" mean in the context of risk pressure?
A compliance framework has controls that no policy pack currently covers.
A cloud connector has not been configured for one or more provider accounts.
A finding or risk has not been linked to a business process or accountable owner, leaving it as unattributed exposure.
A treatment plan has exceeded its target remediation date without being updated.
Move on when you have at least one business process defined with supporting assets and an assigned owner.
4

Treatment Planning

Turn risk decisions into tracked, accountable work.

What treatments are

A treatment plan in CloudSignals is the formal record of what your organization is doing about a specific risk or finding. Where findings are passive observations ("this control is failing"), treatments are active commitments ("here is what we're doing, who owns it, by when, and what evidence we'll produce").

Treatments are the bridge between the technical risk layer (findings) and the operational risk layer (governance decisions and audit evidence). Without them, risk decisions exist only in meeting notes or tickets that aren't connected to the risk system of record.

Treatment types

TypeWhen to useWhat to document
Remediate The root cause can and should be fixed. This is the preferred path for Critical and High findings. Fix description, assigned engineer, target completion date, testing/verification method, linked ticket.
Mitigate Full remediation is blocked (technical constraint, migration in-flight, vendor dependency). A compensating control reduces likelihood or impact in the interim. Compensating control description, why remediation is deferred, interim risk residual assessment, future remediation target date.
Accept The residual risk is within risk appetite and a business justification exists. Requires explicit approval from a named approver. Justification statement, named approver, expiry date (must be time-bounded), conditions that would trigger re-evaluation.
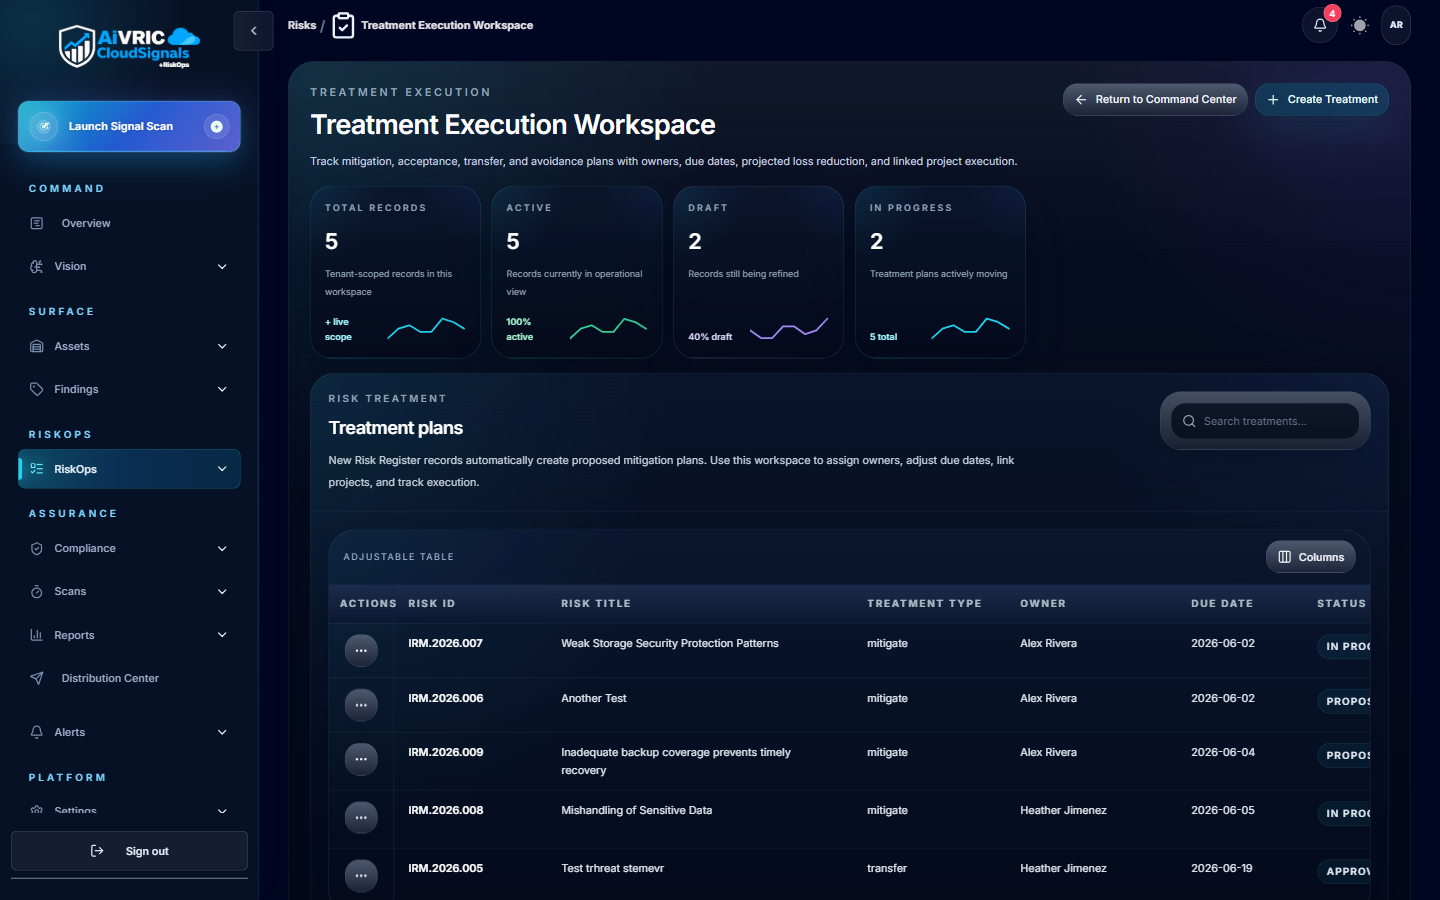
/risks/treatments Expand Treatment Execution Workspace showing active treatment plans with RMR IDs, risk titles, treatment type, assigned owner, due date, and current status
Treatment Execution Workspace — each row is a formal commitment: risk ID, treatment type, assigned owner, target date, and current status. The stats row shows decision throughput at a glance.

What a good treatment plan includes

  • Linked source: The finding(s) or risk register entry this plan addresses
  • Assigned owner: A named individual accountable for execution
  • Treatment type: Remediate, Mitigate, or Accept
  • Description: What specifically will be done (or why acceptance is justified)
  • Target date: When the treatment is expected to be complete or next reviewed
  • Evidence requirement: What proof of completion will be collected (for auditors)
In the platform — Create a treatment plan
1
Navigate to Treatments under the Risks section (or go to /risks/treatments).
2
Click Create treatment plan. Link the plan to the finding or risk you triaged in Phase 2. If you're treating multiple related findings, you can link multiple sources to one plan.
3
Select the treatment type (Remediate / Mitigate / Accept) and fill in the required fields. For Accept, you must supply a justification and expiry date — the platform will enforce this.
4
Assign the plan to an owner. This person will receive notifications when the target date approaches or if the linked finding re-activates.
5
Set a target date. For Remediate plans, align with your engineering sprint calendar. For Accept plans, set the expiry within your organization's risk acceptance policy (typically 90–365 days maximum).
6
Submit the plan. It will move to Pending decisions status until a governance approver reviews and approves it. Continue creating plans for your remaining Critical and High findings.

Key actions for this phase

Create treatment plans for all Critical findings: Every Critical finding triaged as "Remediate" or "Mitigate" should have a treatment plan with an owner and target date before this phase ends.
Document risk acceptance for accepted findings: Each accepted finding needs: a named approver, a justification statement, and an expiry date.
Review existing treatment plans for completeness: Check that any treatment plans already in the system have linked findings, assigned owners, and target dates.
Integrate with your project tracker: If your team uses Jira or ServiceNow, configure the integration so treatment plans auto-create tickets and sync status bidirectionally. This prevents dual-entry and ensures the risk system stays current.
Knowledge Check
Which treatment type should you use when remediation is blocked by a vendor dependency but you've implemented an additional network control to reduce the risk in the interim?
Accept — document the vendor constraint as a justification for accepting the risk.
Mitigate — you're reducing residual risk with a compensating control while remediation remains deferred, with a future target date.
Remediate — the compensating control counts as a fix even if the root cause remains.
No treatment needed — vendor-caused findings are excluded from your risk score.
Move on when all Critical findings have an associated treatment plan with an owner and target date.
5

Governance & Closure

Close the decision loop so risk doesn't pool at the approval stage.

What governance decisions are

A governance decision is the formal approval or rejection of a treatment plan by an authorized decision-maker. It is the final step in the RiskOps chain — the moment a risk moves from "being worked" to "formally resolved or accepted."

In CloudSignals, governance decisions surface in the Pending Decisions queue under Treatments. Each pending item represents a treatment plan that has been submitted and is awaiting a formal disposition. This queue is where most RiskOps programs experience their most significant bottleneck — treatment plans are created, but approvals lag.

Decision types

Approve

The treatment plan is accepted as adequate. The risk is now formally governed. Evidence is captured. For remediation plans, the finding will close when the fix is verified. For acceptance plans, the finding is suppressed until the expiry date.

Return for rework

The treatment plan is insufficient — missing information, inadequate controls, or the justification for acceptance doesn't meet policy requirements. The plan is returned to the owner with feedback. This is preferable to rejection; it keeps the work moving.

Reject

The plan is rejected outright — typically used when an acceptance plan violates policy and the only acceptable path is remediation. Rejection creates a new required action and keeps the finding in active status.

Interaction recording
Findings triage in action — filter to Critical, hover to review context, click to open the detail panel and select a treatment disposition.

Why pending decisions queue up

A large pending decisions backlog is almost always a process problem, not a technical one. Common root causes:

  • No named approver: Treatment plans are created but not routed to a decision-maker. Every treatment plan needs a named approver who has been informed of their role.
  • Approval authority not defined: The team hasn't established who can approve what. Create a simple matrix: who can approve remediation plans (team lead), who can approve risk acceptance (manager or CISO), and what dollar threshold or severity tier triggers an escalation.
  • Approvers not notified: CloudSignals sends notifications — confirm that your approvers have notification rules configured and that alerts aren't routing to a shared inbox that nobody monitors.
  • No governance cadence: Approvals should happen on a defined schedule — weekly for remediation plans, monthly for acceptance plans. Without a calendar commitment, approvals are perpetually "not urgent enough."
In the platform — Work the pending decisions queue
1
Navigate to Treatments under Risks (or go to /risks/treatments). Click the Pending Decisions tab.
2
Sort by linked severity — work Critical-linked plans first. A remediation plan for a Critical finding should be approved (or returned for rework) before Medium-linked plans.
3
Click into the first treatment plan. Review: the linked finding(s), the proposed treatment, the owner, and the target date. Verify the plan is complete and the approach is sound.
4
Make your decision: Approve (plan is adequate), Return for rework (plan needs improvement — add a comment explaining what's missing), or Reject (plan is not acceptable and remediation is required).
5
For risk acceptance plans, confirm the justification is specific and defensible — not generic. Confirm the expiry date is within policy limits. Add your approver name and submit.
6
After your first governance session, review your Portfolio view (/risks/portfolio). The portfolio exposure figure represents the aggregate financial value of unmitigated, open risk. As treatment plans are approved and remediation progresses, this figure should decrease over time.

Key actions for this phase

Process all Critical-linked pending decisions: Work through every pending decision linked to a Critical finding. None should remain pending after your first governance session.
Establish an approval authority matrix: Document who can approve remediation plans, who can approve risk acceptance, and at what severity or business process tier escalation is required.
Configure approval notifications: Verify that named approvers are receiving pending decision alerts via their preferred channel (email, Slack, or Teams).
Schedule a recurring governance review: Block a bi-weekly or monthly slot for the governance review meeting. This should include: pending decisions review, portfolio exposure trend, and risk acceptance renewals approaching expiry.
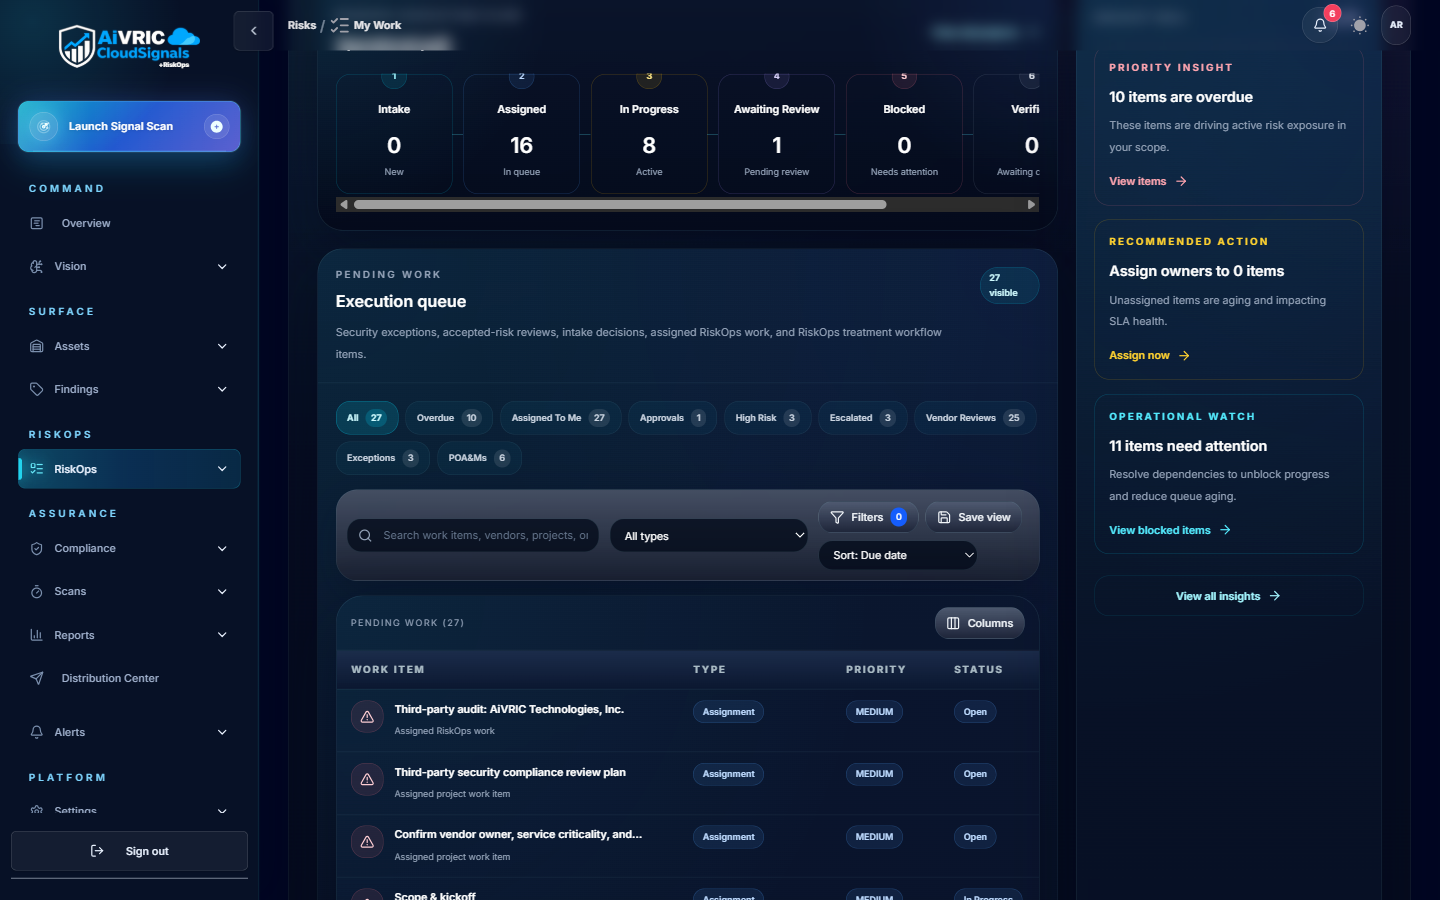
/risks/my-work Expand My Work execution queue showing 16 assigned items, 0 overdue, active risk tasks with owner assignments and priority levels
My Work — the personalized execution queue shows every pending risk decision, treatment approval, and remediation task assigned to you. This is the daily starting point for the governance closure phase.
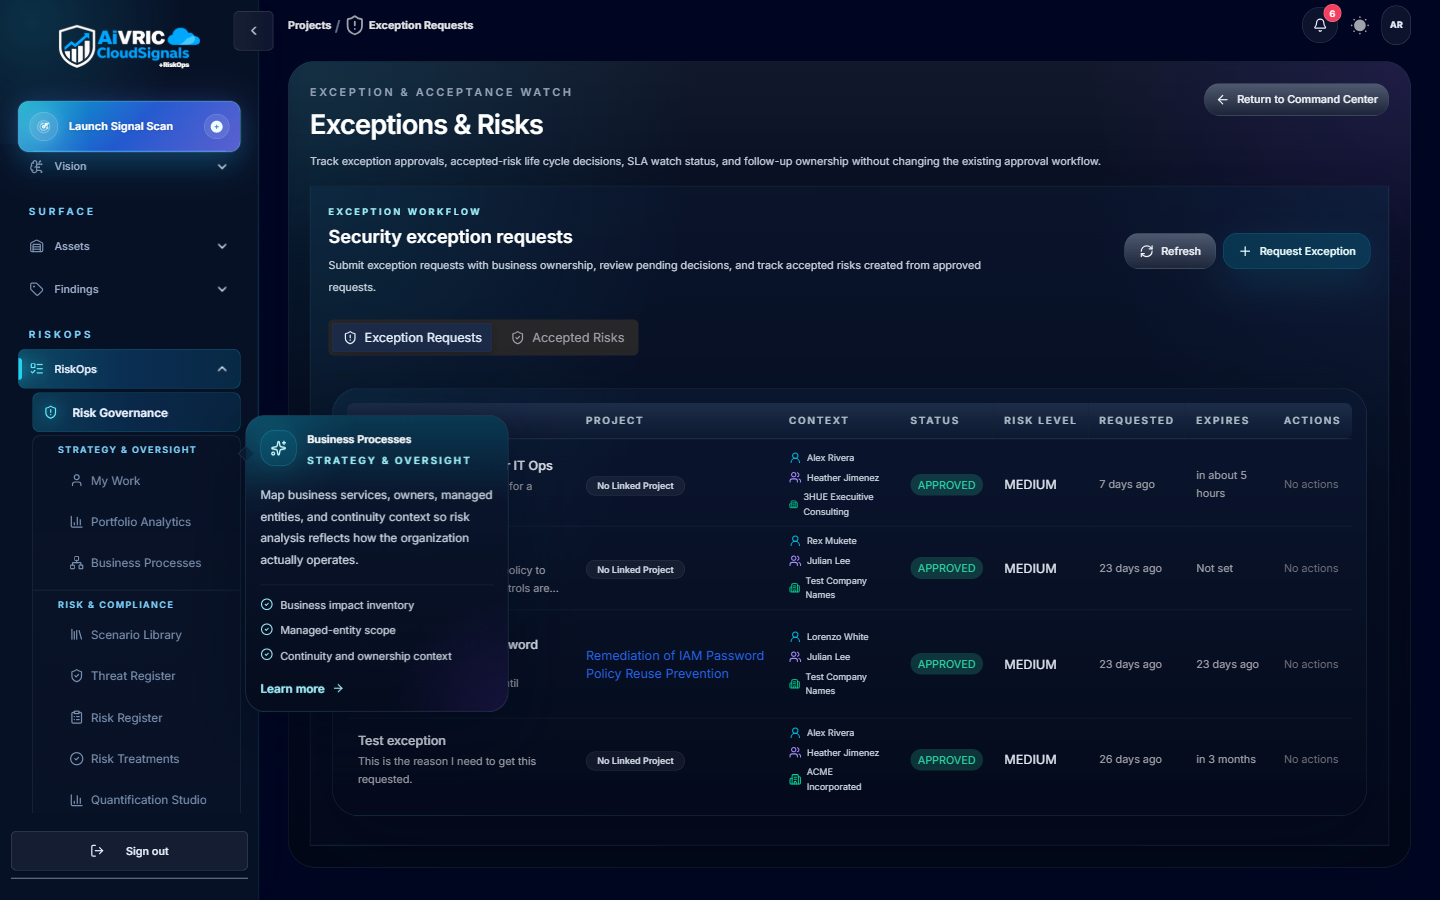
/projects/exceptions Expand Exceptions and Risks page showing security exception requests table with business unit, type, risk tier, status, and approval columns
Exceptions & Risks — formal security exception requests are tracked with business unit, type, risk tier, and approval status. Every accepted risk requires a documented decision before the governance loop is closed.
Knowledge Check
A large pending decisions queue is almost always caused by which of the following?
Cloud connectors are generating duplicate findings, inflating the decision count.
Compliance frameworks are misconfigured, requiring extra approvals per finding.
Approval authority isn't defined, approvers aren't notified, or there's no recurring governance cadence to work through decisions.
The asset inventory is incomplete, blocking finding-to-treatment linkage.
Move on when you've processed Critical-linked pending decisions and established a governance cadence.

Measuring RiskOps health

Once the end-to-end flow is running, you need metrics that tell you whether the process is healthy — not just whether it's running. The four metrics below are the core KPIs for an operational RiskOps program.

MetricWhat it measuresTarget directionWhere to find it
Risk Pressure Score Composite score (0–100) weighted by finding severity, asset criticality, mapping gaps, and ownership gaps. Higher score = more unmanaged exposure. Lower over time; 30 or below is a healthy baseline for a mature program. /risks — Risk Governance summary
Pending Decisions Count of treatment plans awaiting governance approval. A leading indicator of decision bottleneck. Should trend toward zero after each governance session. Sustained growth indicates a broken approval process. /risks/treatments — Pending Decisions tab
MTTR (Mean Time to Remediate) Average time from finding creation to verified closure, measured per severity tier and team. Critical < 7 days; High < 30 days. Watch for teams with outlier MTTR — it's a capacity or process signal. /risks — Analytics / MTTR view
Portfolio Exposure Aggregate financial exposure of unmitigated open risks, scored and rolled up across all business processes. Used for executive and board reporting. Should decrease as treatment plans are approved and remediation progresses. /risks/portfolio

Interpreting your baseline

When you run RiskOps for the first time, your metrics will look alarming. That's expected — you're seeing the accumulated technical debt that existed before you had visibility. The goal in the first 30 days isn't to have perfect metrics; it's to establish a baseline and demonstrate that the numbers are trending in the right direction.

A weekly decline in pending decisions, a falling risk pressure score, and a reducing MTTR trend are the three signals that prove RiskOps is working — even if the absolute numbers are still high.
Reporting cadence: Share portfolio exposure and risk pressure trend data with leadership monthly. Share MTTR and pending decisions data with engineering teams weekly. Different audiences need different views — the platform's export and scheduled report features let you configure both.
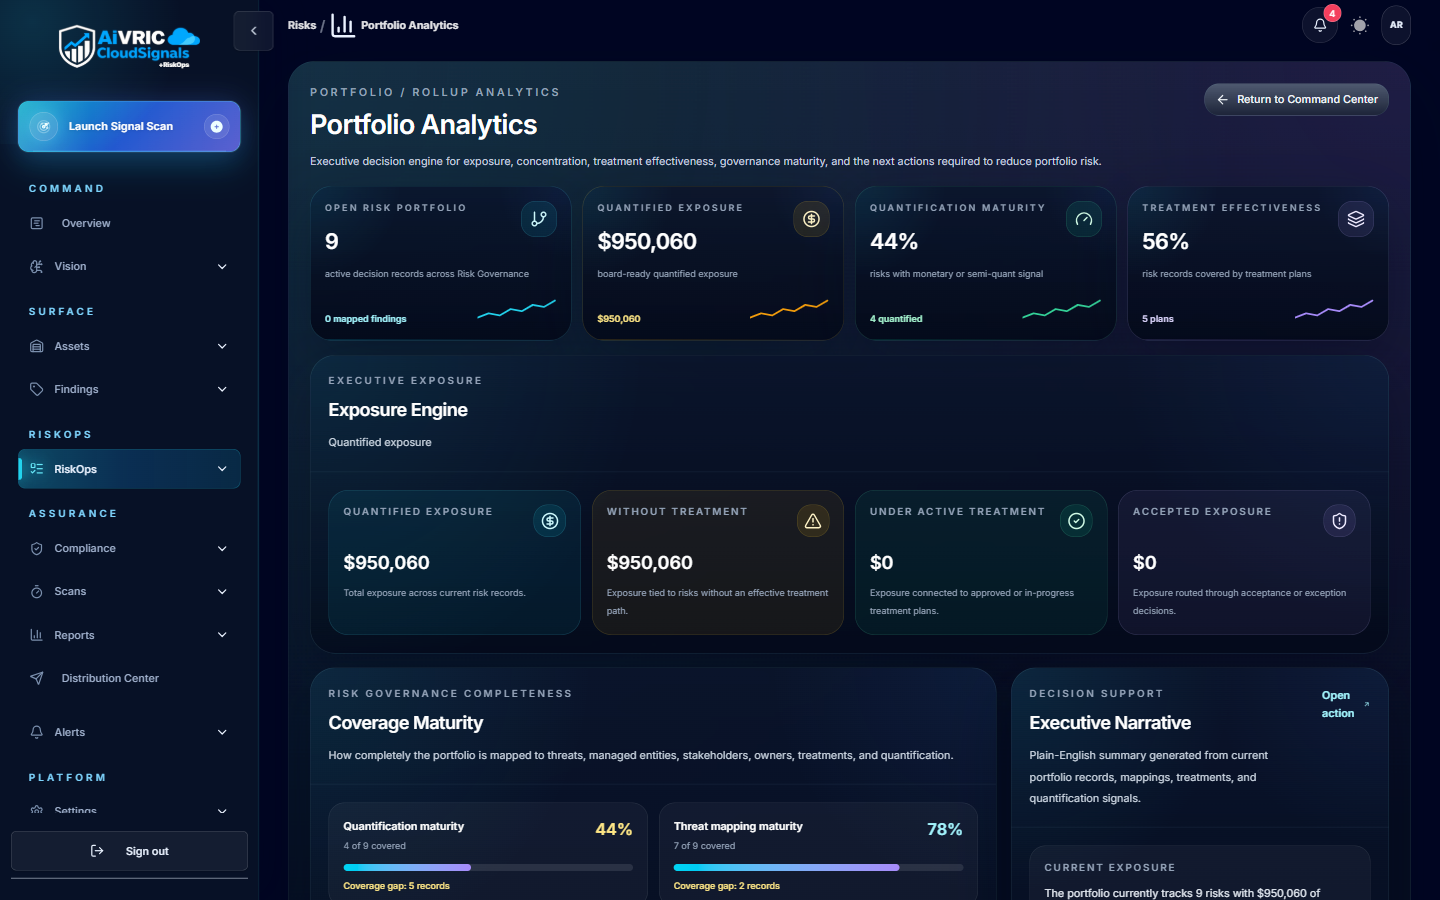
/risks/portfolio Expand Portfolio exposure view showing aggregated financial risk exposure across business processes and managed entities with trend data
Portfolio exposure — the aggregate financial view of unmitigated open risk. As treatment plans are approved and remediations close, this number should trend down over successive reporting periods.
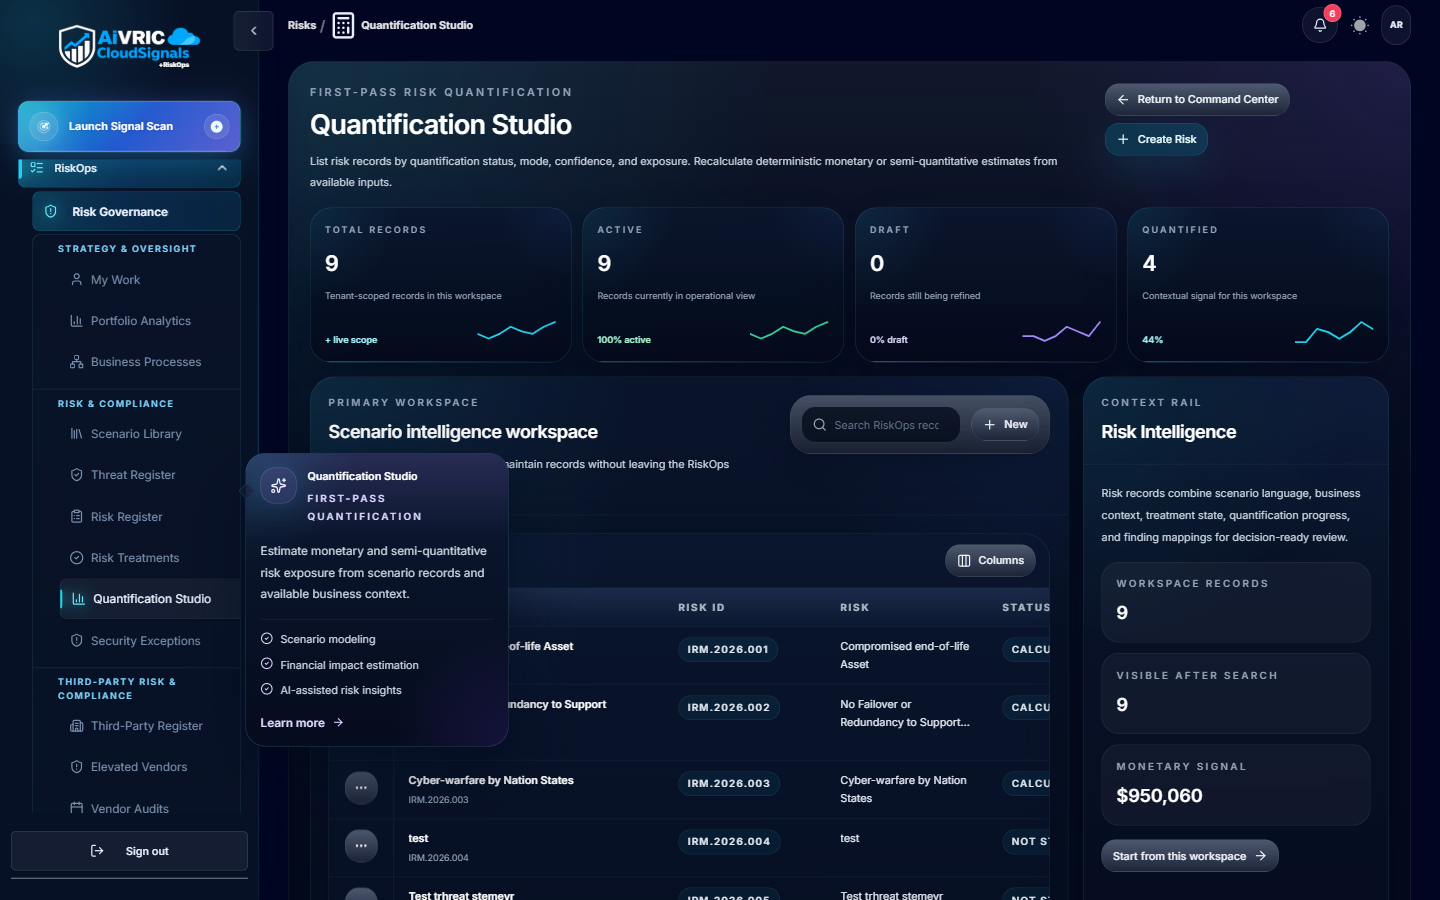
/risks/quantification Expand Quantification Studio showing Scenario Intelligence workspace with risk records, financial exposure values, probability distribution, and Risk Intelligence panel showing portfolio exposure of $950,060
Quantification Studio — converts technical risk records into financial exposure estimates. The portfolio exposure roll-up ($950,060 in this example) gives executives and boards a business-language view of unmitigated risk.
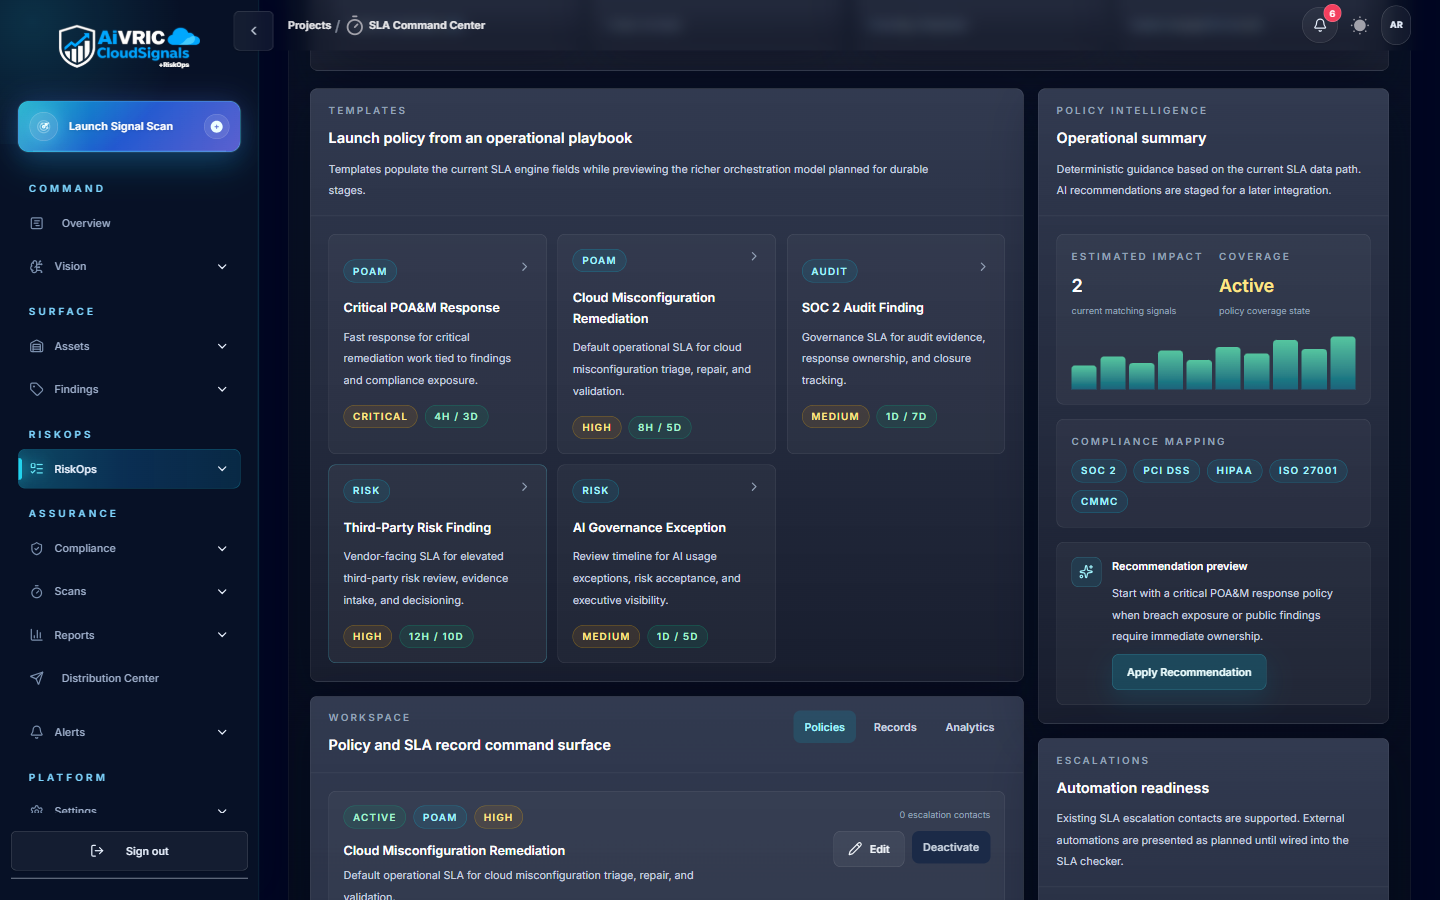
/projects/sla Expand SLA Command Center showing operational playbook with Critical Firewall Response, Cloud Misconfiguration Default, SOC 2 Audit Finding, AI Governance Exception items and automation readiness panel
SLA Command Center — launch policy-driven response playbooks for recurring risk types. Each playbook defines SLAs, escalation paths, and automation steps — turning the governance cadence into a repeatable operational process.

What to do next

Run your first posture report

Generate a posture summary from the Reports panel showing findings by severity, coverage gaps, and trend from your baseline. Share with stakeholders as evidence the program is active.

Evidence exports →

Connect your SIEM or ticketing system

Integrate CloudSignals with Splunk, Sentinel, Jira, or ServiceNow to remove manual data-entry from the triage and treatment workflow.

Integrations guide →

Map to a compliance framework

Enable SOC 2, ISO 27001, or PCI DSS policy packs. Findings are automatically tagged to controls, and evidence bundles are generated for assessors.

Compliance overview →

Expand asset coverage

Add remaining cloud accounts, Kubernetes clusters, and SaaS platforms to your connector configuration. Coverage gaps are the #1 source of unknown risk.

Connector guides →
🏅
Course complete!
You've completed Getting Started with RiskOps. Your organization now has the foundation for a continuous, operationalized risk management process.
Explore more courses
Need hands-on help? Book a guided RiskOps implementation session with the AiVRIC team at calendly.com/aivric-sales or email support@aivric.com. We'll walk through your specific tenant data and help prioritize the first sprint of RiskOps work.